> ## Documentation Index
> Fetch the complete documentation index at: https://docs.converlens.com/llms.txt
> Use this file to discover all available pages before exploring further.
# Navigating Chart
## Landing page
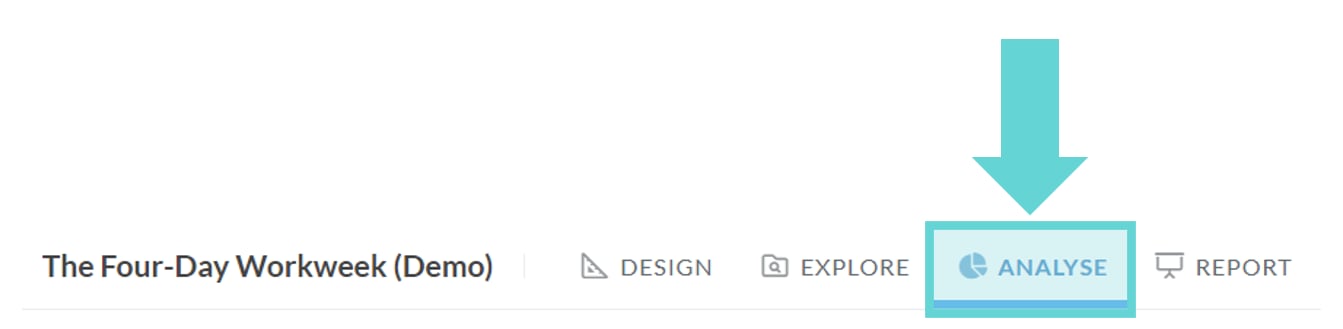
To access the Chart page, click the Analyse tab in the Project Navigation Bar:
 ## Navigation
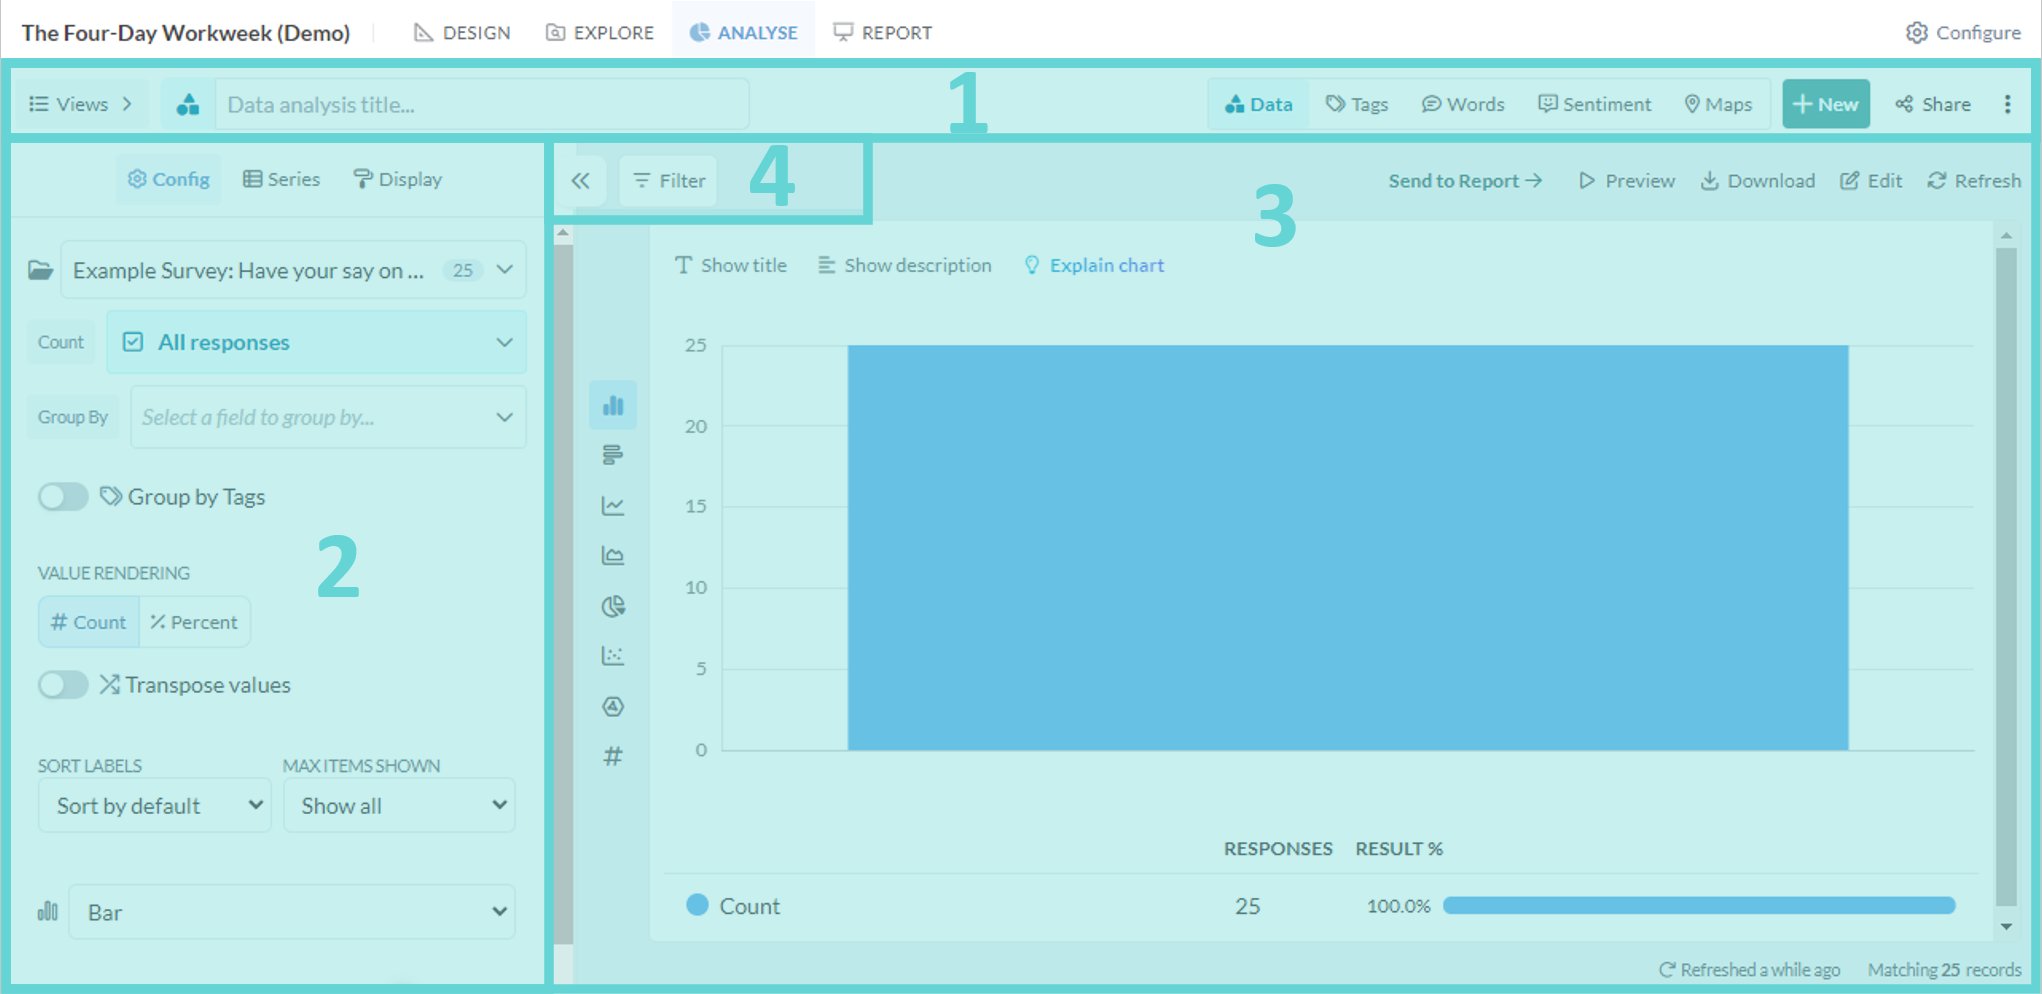 This will show the Analyse page where you can create data visualisations with the responses in your project. There are a number of features and functions within this page.
* (1) [Analyse Navigation Bar](/docs/01-03-04-02-06__view-bar-tools): access data, tag, word, sentiment, map, saved view and sharing options from this menu
* (2) [Settings Panel](/docs/01-03-04-02-05__universal-chart-settings): edit data visual settings and display
* (3) [Stage](/docs/01-03-04-02-02__chart-stage): shows the data visualisation, enables editing and downloading
* (4) [Filter Panel](/docs/01-03-04-02-03__filter-panel-options): apply filters to the data being analysed
This will show the Analyse page where you can create data visualisations with the responses in your project. There are a number of features and functions within this page.
* (1) [Analyse Navigation Bar](/docs/01-03-04-02-06__view-bar-tools): access data, tag, word, sentiment, map, saved view and sharing options from this menu
* (2) [Settings Panel](/docs/01-03-04-02-05__universal-chart-settings): edit data visual settings and display
* (3) [Stage](/docs/01-03-04-02-02__chart-stage): shows the data visualisation, enables editing and downloading
* (4) [Filter Panel](/docs/01-03-04-02-03__filter-panel-options): apply filters to the data being analysed