> ## Documentation Index
> Fetch the complete documentation index at: https://docs.converlens.com/llms.txt
> Use this file to discover all available pages before exploring further.
# Report filters
Report filters enable you to enhance your data visualisations (charts). Report filters are applied when a data visualisation is added, allowing you to select the data source and link multiple visualisations from the same data space. By using report filters, you can synchronise visualisations so that applying a single filter updates all connected visualisations simultaneously.
## Report Filters
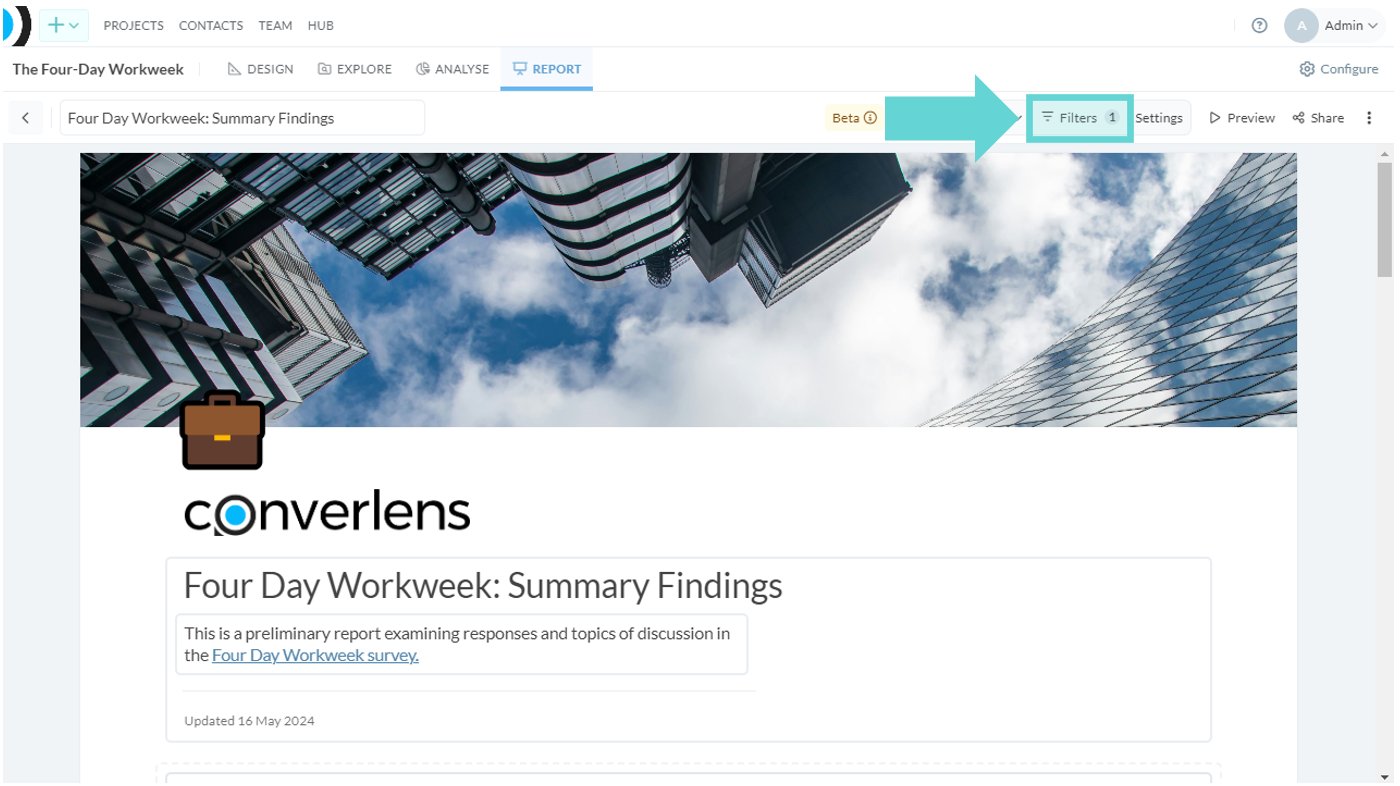 To access and view report filters, click on Filters from the Reports Toolbar.
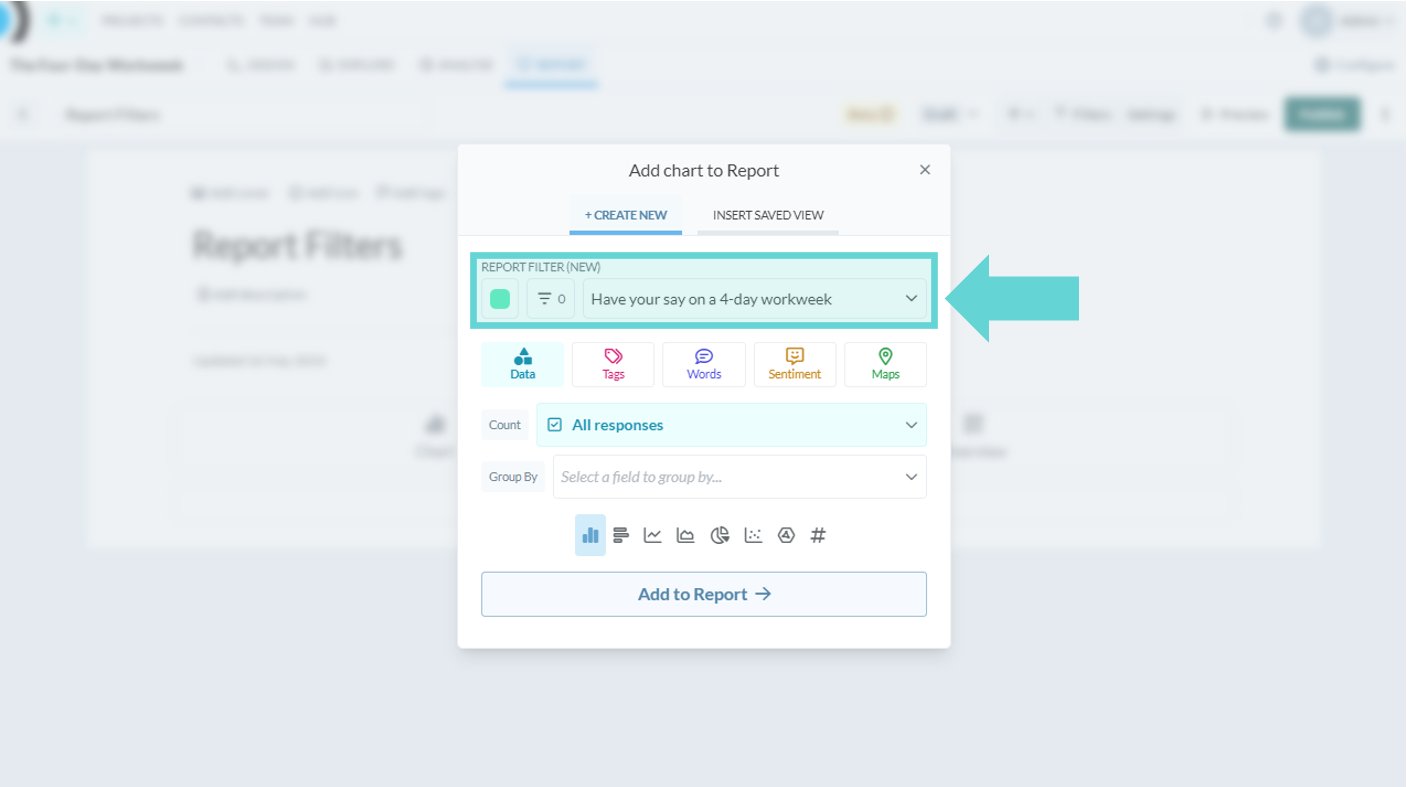
A report without any data visualisations will not have a report filter. When adding a new chart or visualisation, select the Report Filter dropdown from the Chart menu.
To access and view report filters, click on Filters from the Reports Toolbar.
A report without any data visualisations will not have a report filter. When adding a new chart or visualisation, select the Report Filter dropdown from the Chart menu.
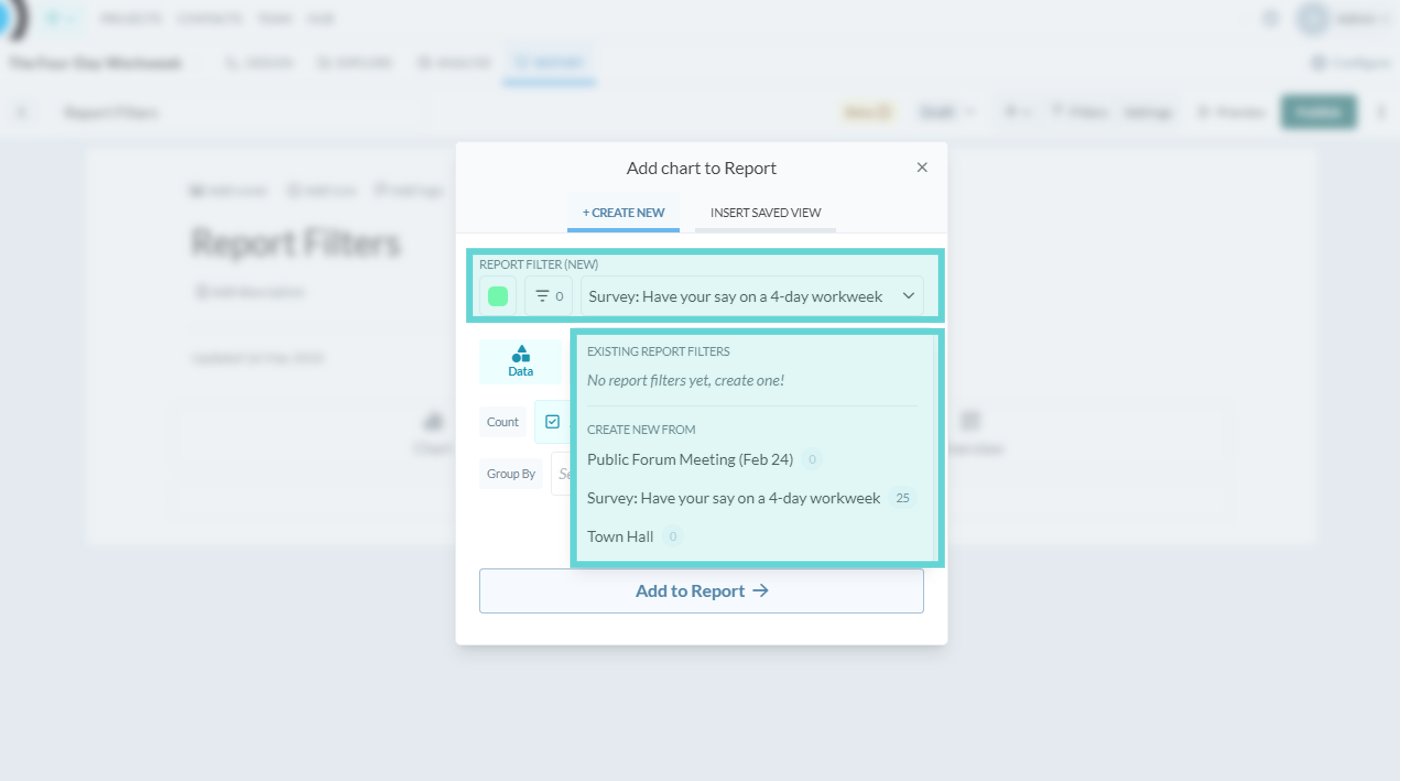 The dropdown will display a list of all the Data Spaces (surveys) available in the Project to pull the data from. Click on the name of the Data Space (survey) you want to create the visualisation from. If you have existing Report Filters, you can select the filter you want to group that chart or visualisation with or choose to create a new filter to keep that visualisation separate.
**Note:** If you are selecting across multiple Data Spaces (surveys), keep each data space consistent by using charts and report filters from the same data space, and avoid crossing data spaces. Most surveys have different structures, questions and blocks, and putting different data spaces together in the same report filter means data filters may only work on one set of charts.
## Report Filters Menu
The dropdown will display a list of all the Data Spaces (surveys) available in the Project to pull the data from. Click on the name of the Data Space (survey) you want to create the visualisation from. If you have existing Report Filters, you can select the filter you want to group that chart or visualisation with or choose to create a new filter to keep that visualisation separate.
**Note:** If you are selecting across multiple Data Spaces (surveys), keep each data space consistent by using charts and report filters from the same data space, and avoid crossing data spaces. Most surveys have different structures, questions and blocks, and putting different data spaces together in the same report filter means data filters may only work on one set of charts.
## Report Filters Menu
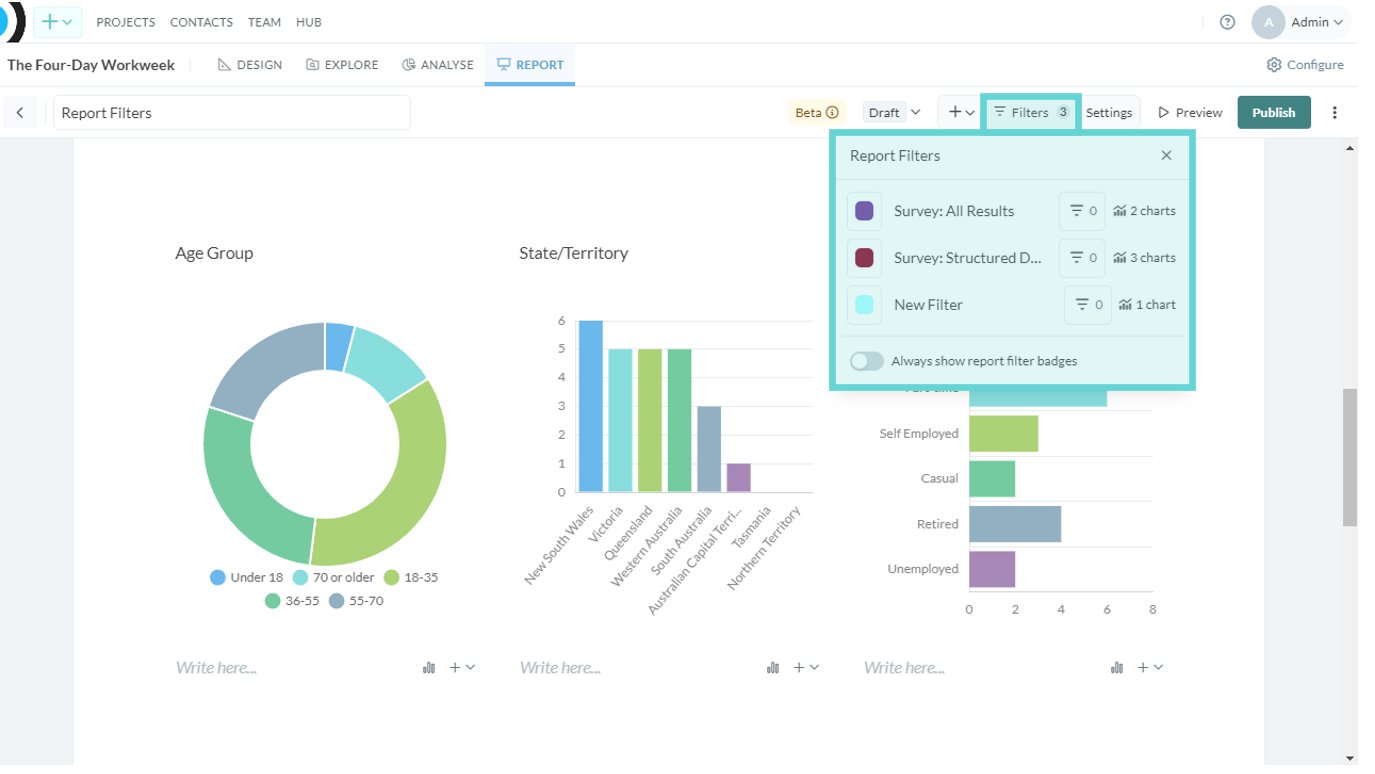 To access and view report filters, click on Filters from the Reports Toolbar. This will open a dropdown menu with a list of your report filters and options:
* **Filter colour:** Click on the coloured square to change the Report Filter colour (this will only affect the Report Filter not the visualisations)
* **Report filter name:** Click on the text to change the Report Filter name i.e. if you have a section like “Structured Data” you can rename the filter for ease of identification later on
* **Data filter:** Click on the data filter icon to apply field filters to all the charts within that Report Filter (see Filter Panel Options for more information on using field filters)
* **Chart count:** Shows the number of visualisations connected (grouped with) that Report Filter
* **Always show report filter badges:** Toggle on/off to show/hide the Report Filter (title and colour) badge on the visualisation/s.
## Add a new Report Filter
To access and view report filters, click on Filters from the Reports Toolbar. This will open a dropdown menu with a list of your report filters and options:
* **Filter colour:** Click on the coloured square to change the Report Filter colour (this will only affect the Report Filter not the visualisations)
* **Report filter name:** Click on the text to change the Report Filter name i.e. if you have a section like “Structured Data” you can rename the filter for ease of identification later on
* **Data filter:** Click on the data filter icon to apply field filters to all the charts within that Report Filter (see Filter Panel Options for more information on using field filters)
* **Chart count:** Shows the number of visualisations connected (grouped with) that Report Filter
* **Always show report filter badges:** Toggle on/off to show/hide the Report Filter (title and colour) badge on the visualisation/s.
## Add a new Report Filter
 To add a new report filter, insert a new visualisation (chart). From the Chart menu, click on the Report Filter dropdown. Underneath “Create New From” select the Data Space to pull your chart data from. Apply required settings for the visualisation and click “Add Chart”.
Once the chart has been added to your report, click on Filters from the Reports Toolbar. The most recently added filter will show at the bottom of the list of Report Filters (usually with the name of the Data Space you just added the new chart from). Here you can change the Report Filter colour, name, and data filter settings.
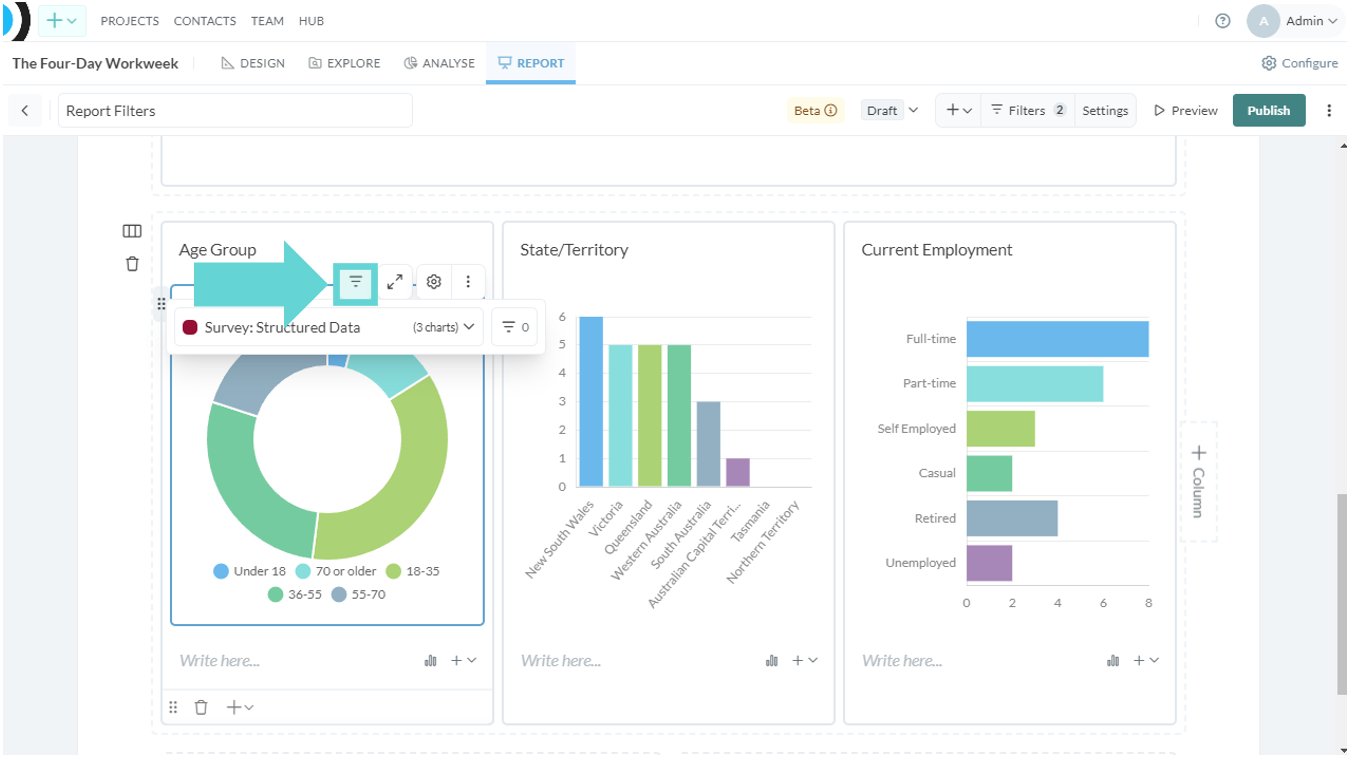
## Change a visualisation’s report filter
To change a visualisation’s (chart’s) report filter from one filter to another, hover over the tile of the chart you want to change. Click on the Filters button from the Chart settings menu:
To add a new report filter, insert a new visualisation (chart). From the Chart menu, click on the Report Filter dropdown. Underneath “Create New From” select the Data Space to pull your chart data from. Apply required settings for the visualisation and click “Add Chart”.
Once the chart has been added to your report, click on Filters from the Reports Toolbar. The most recently added filter will show at the bottom of the list of Report Filters (usually with the name of the Data Space you just added the new chart from). Here you can change the Report Filter colour, name, and data filter settings.
## Change a visualisation’s report filter
To change a visualisation’s (chart’s) report filter from one filter to another, hover over the tile of the chart you want to change. Click on the Filters button from the Chart settings menu:
 Click on the Filter select dropdown. From this menu, click on the Report Filter you would like that chart to be grouped with. The chart will change. You can check this by hovering over the chart to show the report filter badge (or by toggling on the **Always show report filter badges** from the report filters menu). The count of reports in each filter will also update to reflect this change.
 ## Add a Data Filter to a Report Filter
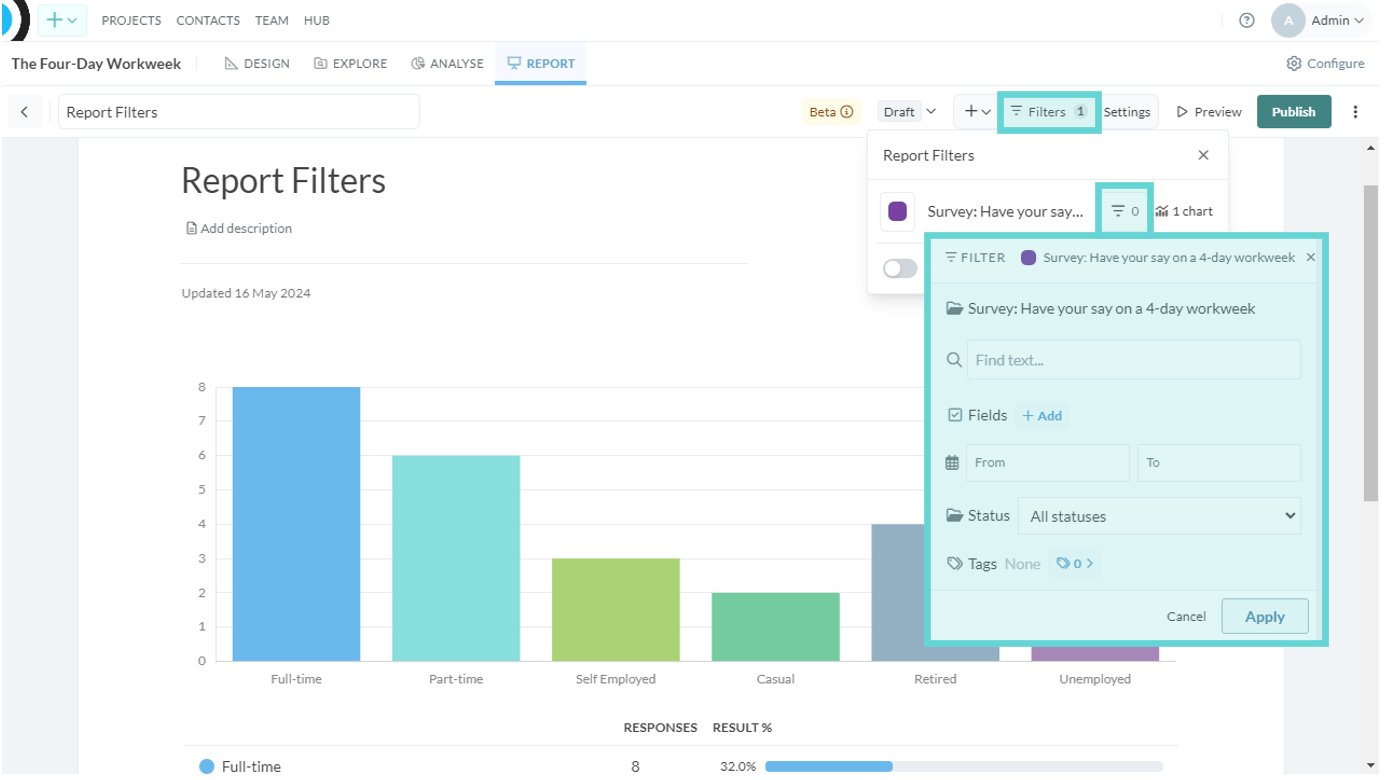 The purpose of Report Filters is to enable you to drive your report using a single point: the Report Filter. Once you have added the Report Filter and grouped the visualisations you want within that filter, click on Filters from the Reports Toolbar and open Data Filter:
From here you can select text, fields (blocks or questions from your survey), date range, status and tags to limit all charts within the Report Filter to results with those filters applied. See [Filter Panel Options](/docs/01-03-04-02-03__filter-panel-options) for more information on using field filters.
The purpose of Report Filters is to enable you to drive your report using a single point: the Report Filter. Once you have added the Report Filter and grouped the visualisations you want within that filter, click on Filters from the Reports Toolbar and open Data Filter:
From here you can select text, fields (blocks or questions from your survey), date range, status and tags to limit all charts within the Report Filter to results with those filters applied. See [Filter Panel Options](/docs/01-03-04-02-03__filter-panel-options) for more information on using field filters.