- Chart types: The panel on the left hand side of the Chart Stage preview shows icons of the different chart types. Toggle between various chart types for the current view.
- Send to report: Open the Send to Report interface to add the visualisation to a new or existing report.
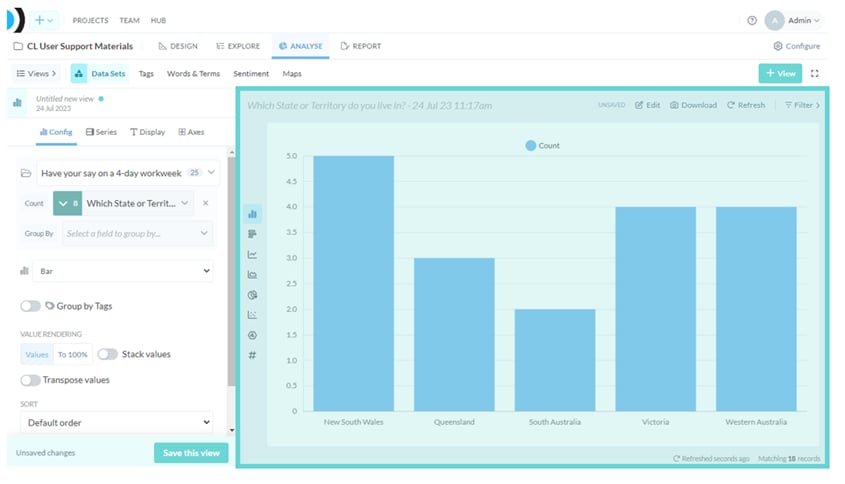
- Preview: View how the visualisation will appear when shared or published.
- Download: Click to download a PNG image file or export the chart data as CSV.
- Edit: Click to display the chart or visualisation data to manually edit values.
- Export: Download a csv (Excel) file of the current data in the chart or visualisation
- Import: Enter comma or tab separated data from an external source
- Refresh: Refresh the chart data with current settings and edits
- Chart Heading: Modify the title, add a description, toggle data counts, and generate an AI-driven summary description of your chart.
- Matching number of records: In the bottom right hand corner, displays the number of results matching the current configuration settings.