Navigation
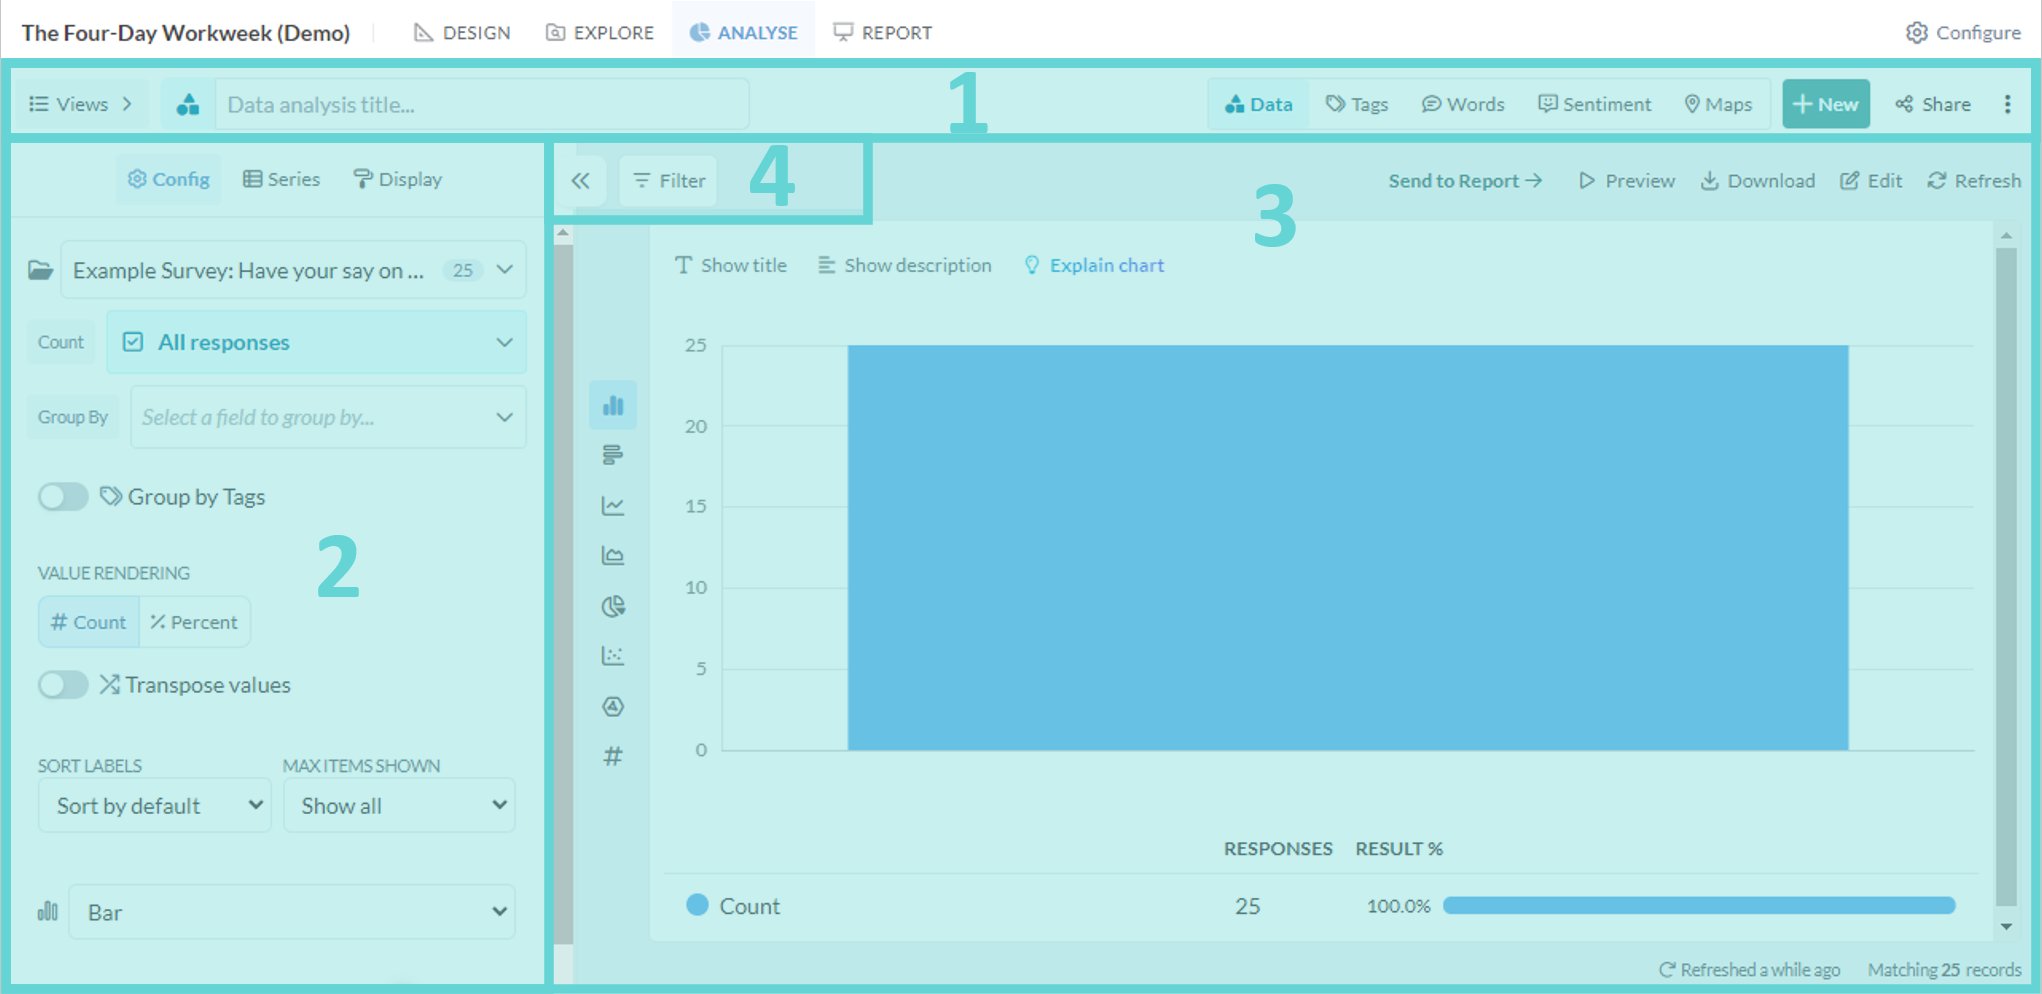
- (1) Analyse Navigation Bar: access data, tag, word, sentiment, map, saved view and sharing options from this menu

- (2) Settings Panel: edit data visual settings and display
- (3) Stage: shows the data visualisation, enables editing and downloading
- (4) Filter Panel: apply filters to the data being analysed
(1) Analyse Navigation Bar
The Analyse Navigation Bar provides access to five analysis functions. It also supports saved views, new charts, publishing and sharing.- Saved: Show the list of saved views for the current survey.
- Data: Display charts based on the data blocks in the survey.
- Tags: If tags have been applied to submissions, chart record-level and coded tags.
- Words: Create and edit customisable word clouds based on survey responses.
- Sentiment: Explore positive, neutral and negative sentiment in text responses.
- Maps: Create data-driven maps from postcode responses.
- New chart: Create a new analysis view. This clears the current unsaved configuration.
- Share: Open publishing, embedding and sharing options for the current saved view.
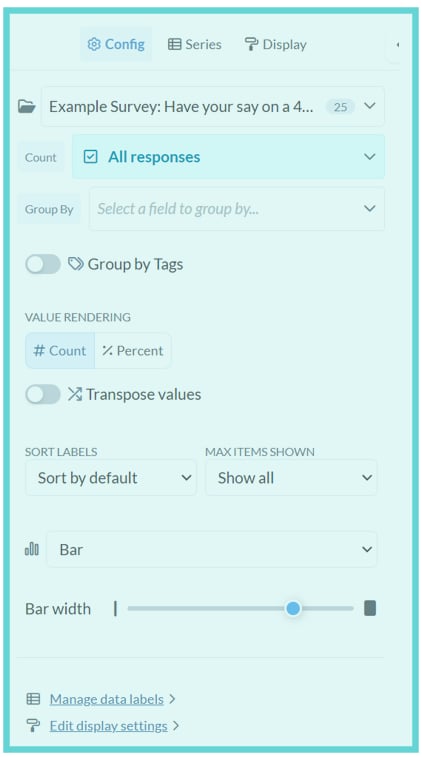
(2) Settings Panel
The Settings Panel on the left hand side of the Analyse screen enables customisation of your data visualisation or chart. Configure data spaces, change chart types, modify series, adjust display options and save personalised views. Use the Settings panel to tailor the visualisation’s appearance and behaviour to suit any project.- Config: Select the data space, block and grouping. Edit chart type, value rendering and chart display settings.
- Series: Edit the chart series to adjust the colour display, and modify the chart’s data categories by selecting or deselecting specific categories to be included or removed from the chart.
- Display: Edit what displays on the chart including title, legend, chart tooltips and value labels.
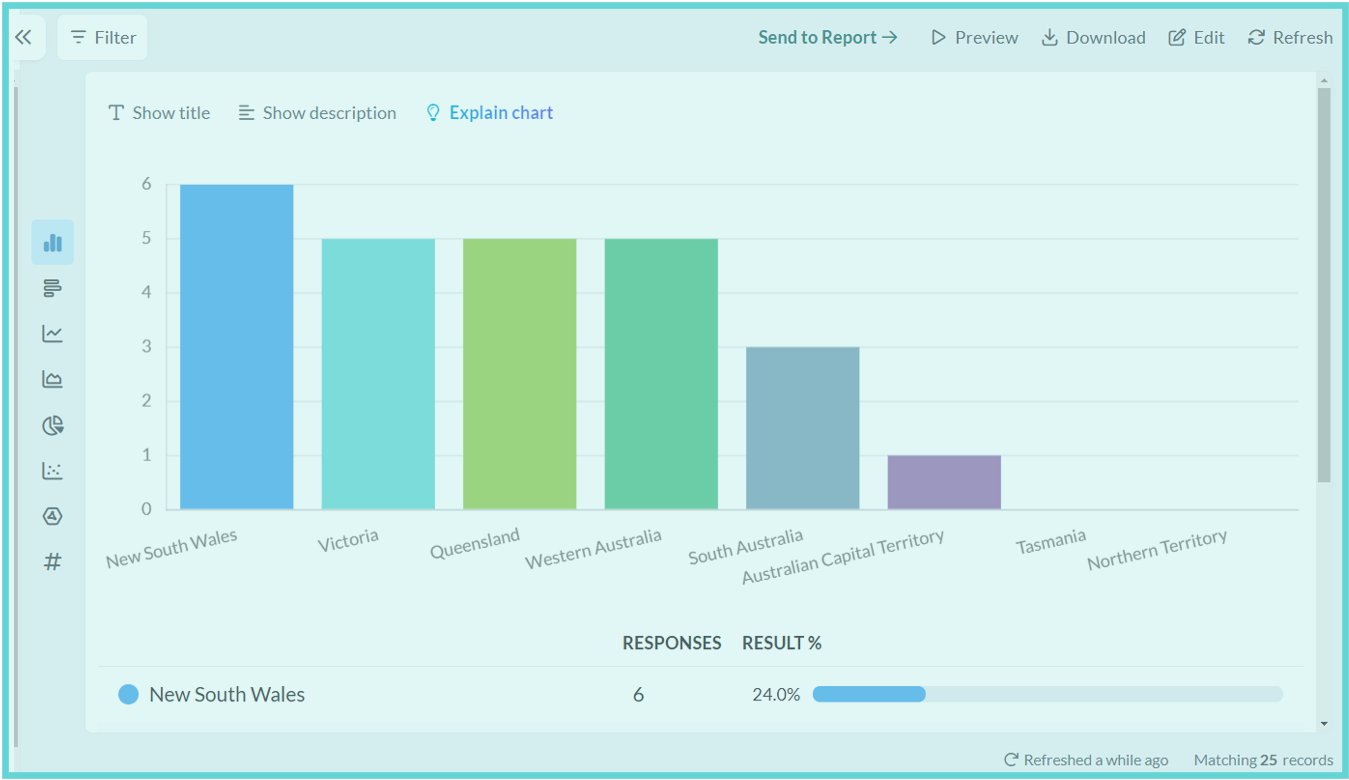
(3) Stage
The Stage area displays a real-time view of the data visualisation as edits are being made in the settings. From here you can change the chart type, edit the chart data, download the chart, resize the chart height and refresh results.- Chart types: The panel on the lefthand side of the Stage preview shows icons of the different chart types. Click to toggle between various chart types for the current view.
- Send to report: Click to send the current visualisation to a new or existing report
- Preview: Click to preview the visualisation for sharing, publishing and embedding.
- Download: Click to download a PNG image file or export the chart data as CSV.
- Edit: Click to display the chart or visualisation data to manually edit values.
- Refresh: Click to refresh the chart with current settings and edits
- Matching number of records: In the bottom right hand corner, displays the number of results matching the current configuration settings.
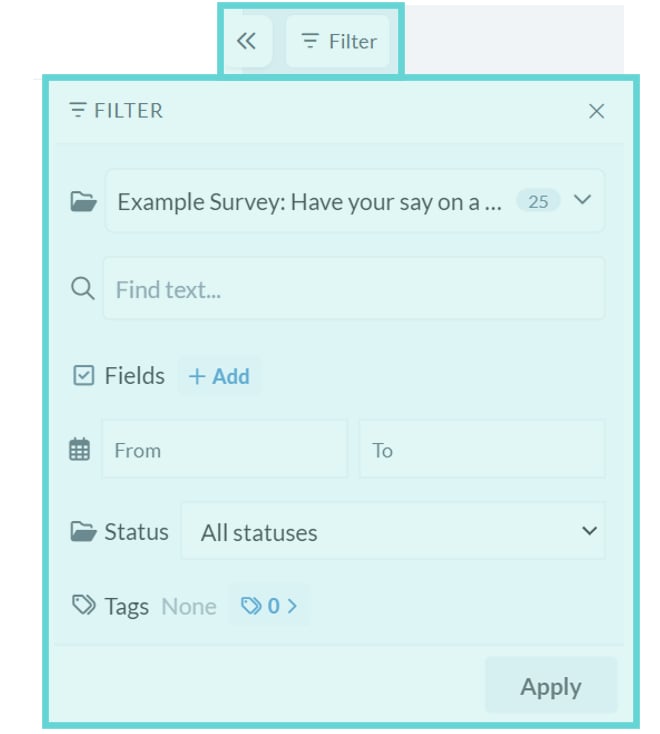
4) Filter panel
The Filter panel enables searching and filtering of the data to chart. Search for text terms, select text fields, add block fields, limit results by date or status, or select results with one or more tags applied.- Survey Space dropdown: Click the dropdown to select other data spaces within the project
- Search bar: The search bar enables text-based searching on the dataset. Enter one or more search terms and the results will filter to only those with the entered search word(s).
- Fields: enables limiting the results to parameters applicable to the survey and dataset (choice and text based blocks).
- Date: The date filter enables filtering responses received in a specified date range. Enter a date from, or a date to, or both, to limit the view to the results that were submitted during that timeframe.
- Status: Limit results to responses with a matching status. Requires response publishing to be enabled.
- Tags: enables limiting results that have the selected tag applied, including record level tags and coded text tags. If these tags have been applied to the dataset it is possible to filter the results by one or more tags.
- Apply: Click to apply filter settings to current visualisation