Landing page
To access the Chart page, click the Analyse tab in the Project Navigation Bar:
Navigation
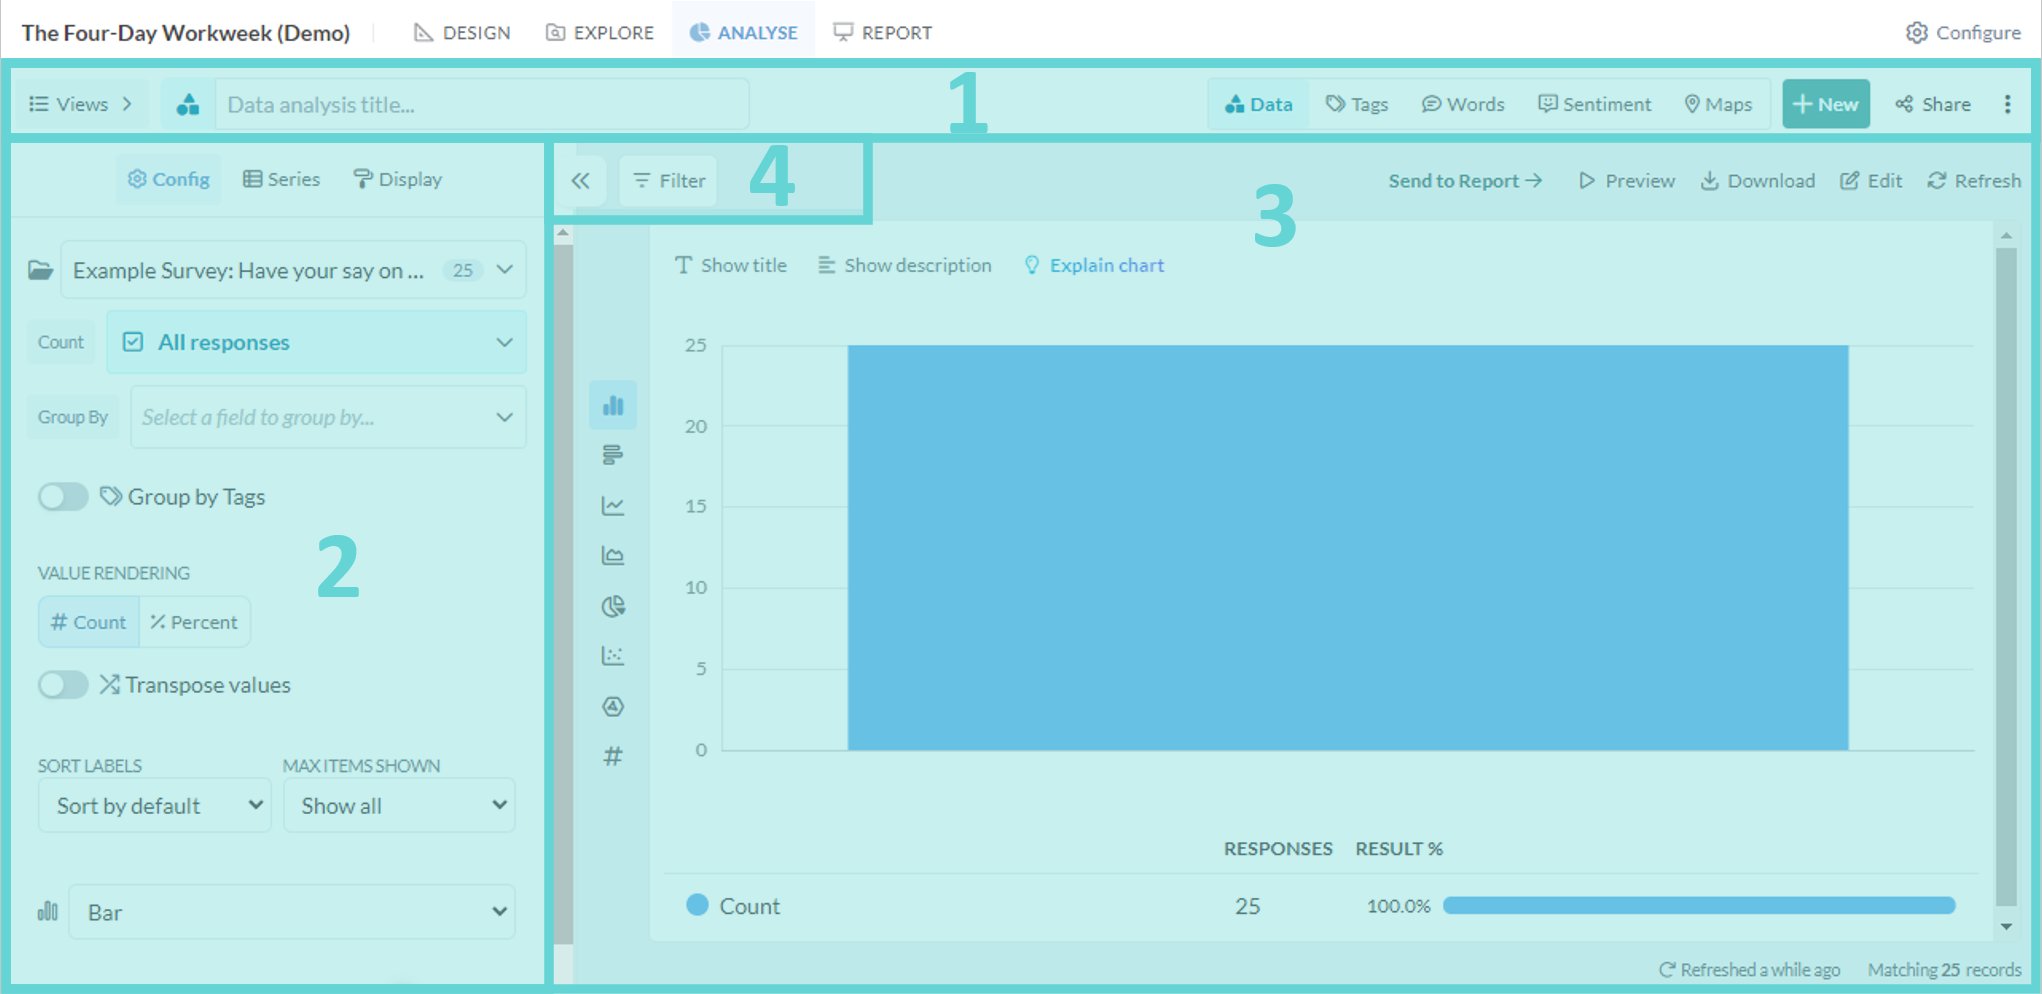
- (1) Analyse Navigation Bar: access data, tag, word, sentiment, map, saved view and sharing options from this menu
- (2) Settings Panel: edit data visual settings and display
- (3) Stage: shows the data visualisation, enables editing and downloading
- (4) Filter Panel: apply filters to the data being analysed