Landing page
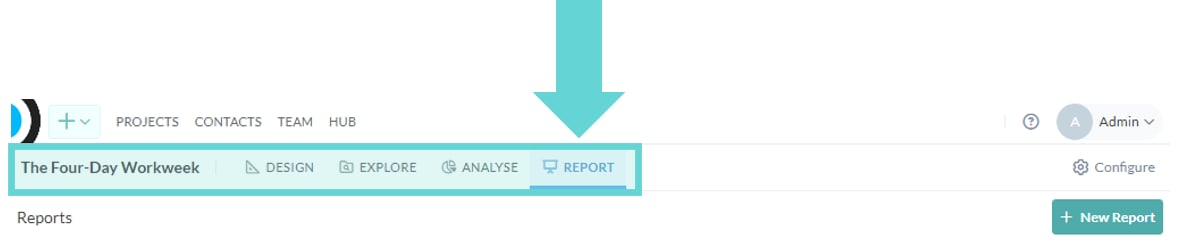
To access the reports page click the Present tab in the Projects section:Create a report
If you have not created any reports for the project you are working in, click the New Report button in the top right hand corner of the window. Alternatively, open a report from the list by clicking on the title. Report permissions: Only Converlens users with Admin or Editor roles are able to create new reports. If you cannot see the New Report button and need to create reports, confirm your user level with your workspace admin. You may need to request an upgrade to your permission levels on the projects you want to create reports in, or alternatively have an Admin or Editor create a report on your behalf.Add cover image
To add a cover image to your report, click the Add cover button in the top left. To change the cover image, click the Change cover button in the right hand side of the banner image. From here, you can search and select a free image from Unsplash, or upload a Custom image. Click the Reposition button to drag the image to your preferred position. You can also switch between an Inset layout or a Banner layout. To delete the cover image click the Remove button on the right hand side of the banner. Remember to save your changes as you edit by clicking the Save changes button in the bottom right hand corner of the window.Add icon
To add an icon to your report, click the Add icon button on the left hand side of the report window underneath the banner. An icon will be randomly generated. To edit the icon, click on the icon to open the emoji window to search and select your preferred icon. To remove the icon from the report, click Remove in the top right corner of the emoji window. Remember to save your changes as you edit by clicking the Save changes button in the bottom right hand corner of the window.Add logo
To add a logo to your report, click the Add logo button on the left hand side of the report window underneath the banner and icon (if added). A flyout window will appear. You can enter a link to your logo image or Upload an image from your device. To remove the logo from the report, click the Remove button in the top right hand corner of the Add logo flyout menu. Remember to save your changes as you edit by clicking the Save changes button in the bottom right hand corner of the window.Add title
To add a title to your report, click the title area showing the text “Untitled report”. Enter your desired title. Remember to save your changes as you edit by clicking the Save changes button in the bottom right hand corner of the window.Add description
To add a description beneath your title, click the Add description area. Start typing in your description. To open Rich Text editing options click anywhere inside the text box and floating menu will appear. From here you can add headings, paragraphs, links, photos and file attachments. You also can change the text to bold and italic. Remember to save your changes as you edit by clicking the Save changes button in the bottom right hand corner of the window.Add content (Row)
To add a text block to your report, click the + button in the report toolbar and select Text Block under Elements. A text block will be added into your report. From here you can add headings, subheadings, paragraphs, links, photos and file attachments. You also can change the text to bold and italic. Remember to save your changes as you edit by clicking the Save changes button in the bottom right hand corner of the window. Tip: You can add multiple columns to a row, and text and charts to each column. Use additional rows to separate sections with different column counts. Blocks can be moved between columns and rows.Add data visualisations (Chart)
To add a chart to your report, click the Chart button at the bottom of your report or click the + button in the report toolbar and select Chart/Analysis under Data Widgets. You can also add a chart inside an existing row by opening the row’s add menu. From here you can select to add a new chart, or add an existing saved chart. There is a lot you can do with charts so please read the detailed guide when you are ready to dive further in. Charts are added to the “last column”, which means they get inserted at the end of your existing content. Tip: Charts require quantitative data (non-text blocks), except for Words (word clouds) which requires qualitative data (text blocks). For more information on the different block types, see the detailed block settings. For more information on how to create data visualisations with the Chart tool, see Chart.Add a new chart
From the Add chart to Report menu, select +Create New. Select the data space you want to use from the dropdown menu. You can select Data, Tags, Words, Sentiment or Maps for your visualisation. Select the question (block) you want to display and/or group by. Select the chart type from the icons above the Add to Report button (you can change this in the report later if needed). When you are happy with your selections click the Add to Report button. The data visualisation (chart) will be in your report. To edit the visualisation please see the detailed guide.Add an existing chart
If you have a previously saved data visualisation in Chart, from the Add chart to Report menu, select Insert saved view. Click on the title of the saved view you want to add to the report. If you want to edit the chart you will need to open the view in Chart. Please note editing a saved view will affect all reports using this view. To edit the visualisation please see the detailed guide.Preview report
To preview how your report will look on a web-page once shared, click the Preview button in the Report toolbar. This will open an overlay window displaying a preview of your report. To exit this view, simply close out the window by clicking anywhere in the background or selecting the X in the top right corner of the overlay window.Share report with team members
Reports have two statuses:- Draft: Visible only to admins and editors. Cannot be published or shared.
- Active: Visible to logged in team or project members and can be published.
Publish report (Enable public access)
To publish a report and enable public access click Publish in the right hand corner of the Reports toolbar. This will open a popup menu. Click Publish from the popup menu. Your report is now published. A confirmation message will display in the bottom right hand corner of the window. The report will also show a Published label in the list of reports. You can copy the website link or the embed code from the Publish menu. You can also enable “Require a password to view report” and set the report password. For more detail about all the publishing options see Sharing and Publishing.Unpublish report
To unpublish a published report and remove public access open the publish menu by clicking Share in the right hand corner of the Reports toolbar. If the menu is already open (you’ve just published the report) navigate to the next step. The confirmation message in the popup menu will read “Report is published ✔”. Click the teal Unpublish button next to this confirmation to Unpublish the report. A confirmation message will display in the bottom right hand corner of the window.