Report Filters
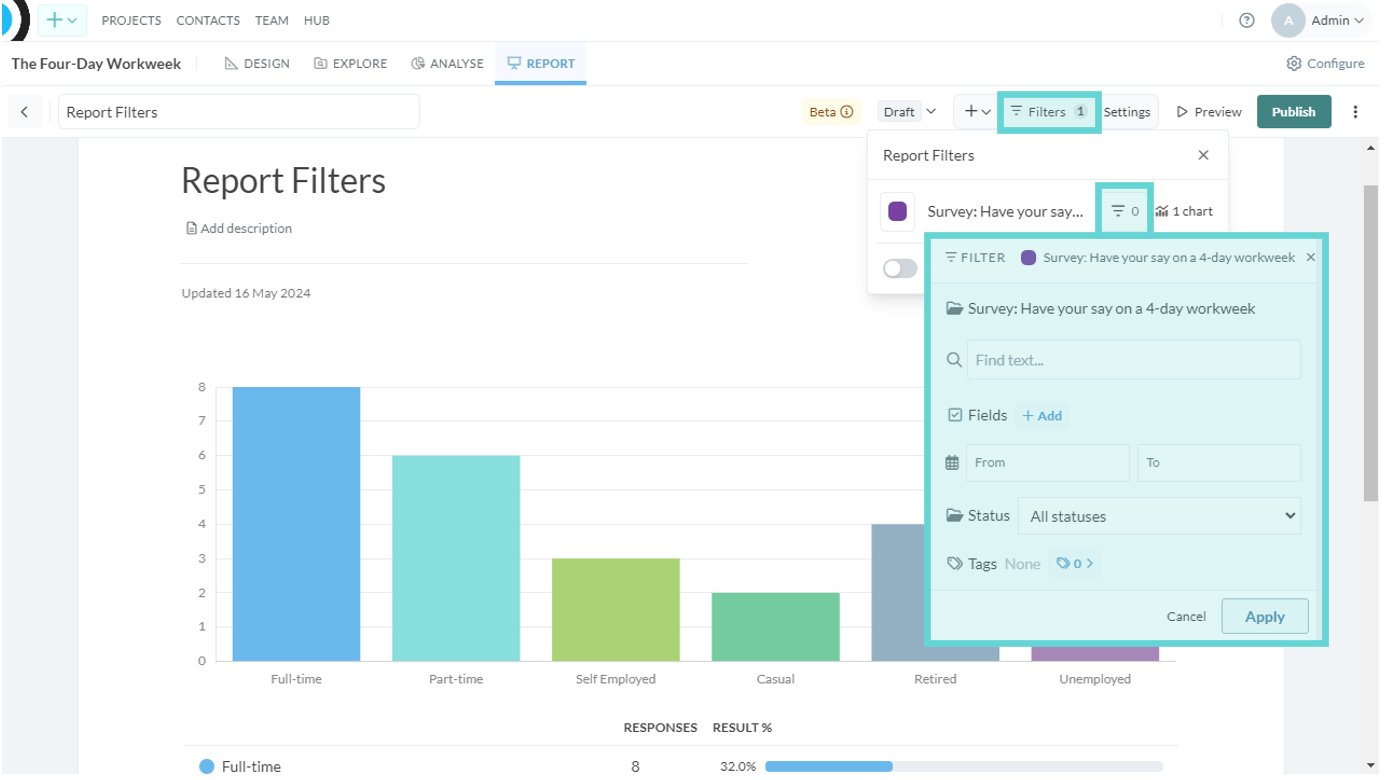
Report Filters Menu
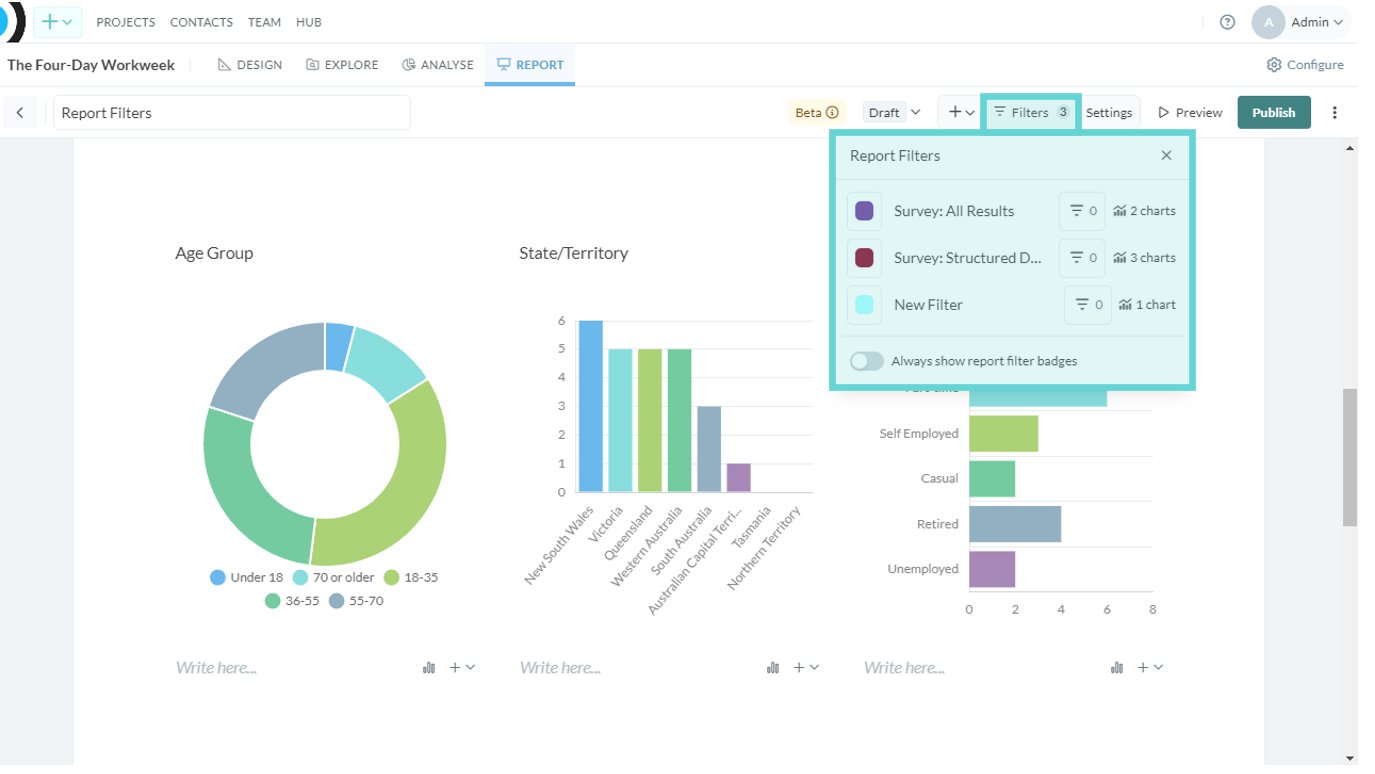
- Filter colour: Click on the coloured square to change the Report Filter colour (this will only affect the Report Filter not the visualisations)
- Report filter name: Click on the text to change the Report Filter name i.e. if you have a section like “Structured Data” you can rename the filter for ease of identification later on
- Data filter: Click on the data filter icon to apply field filters to all the charts within that Report Filter (see Filter Panel Options for more information on using field filters)
- Chart count: Shows the number of visualisations connected (grouped with) that Report Filter
- Always show report filter badges: Toggle on/off to show/hide the Report Filter (title and colour) badge on the visualisation/s.
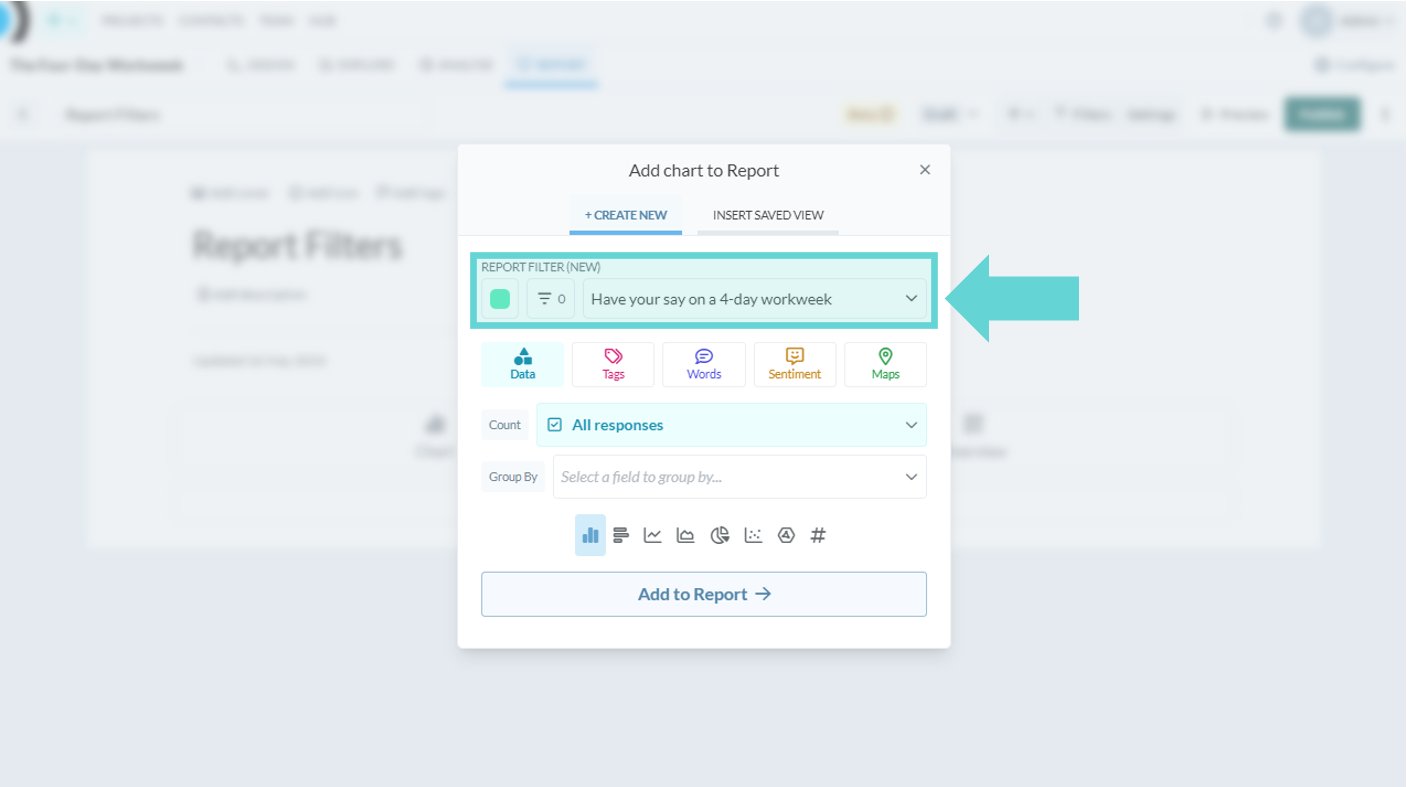
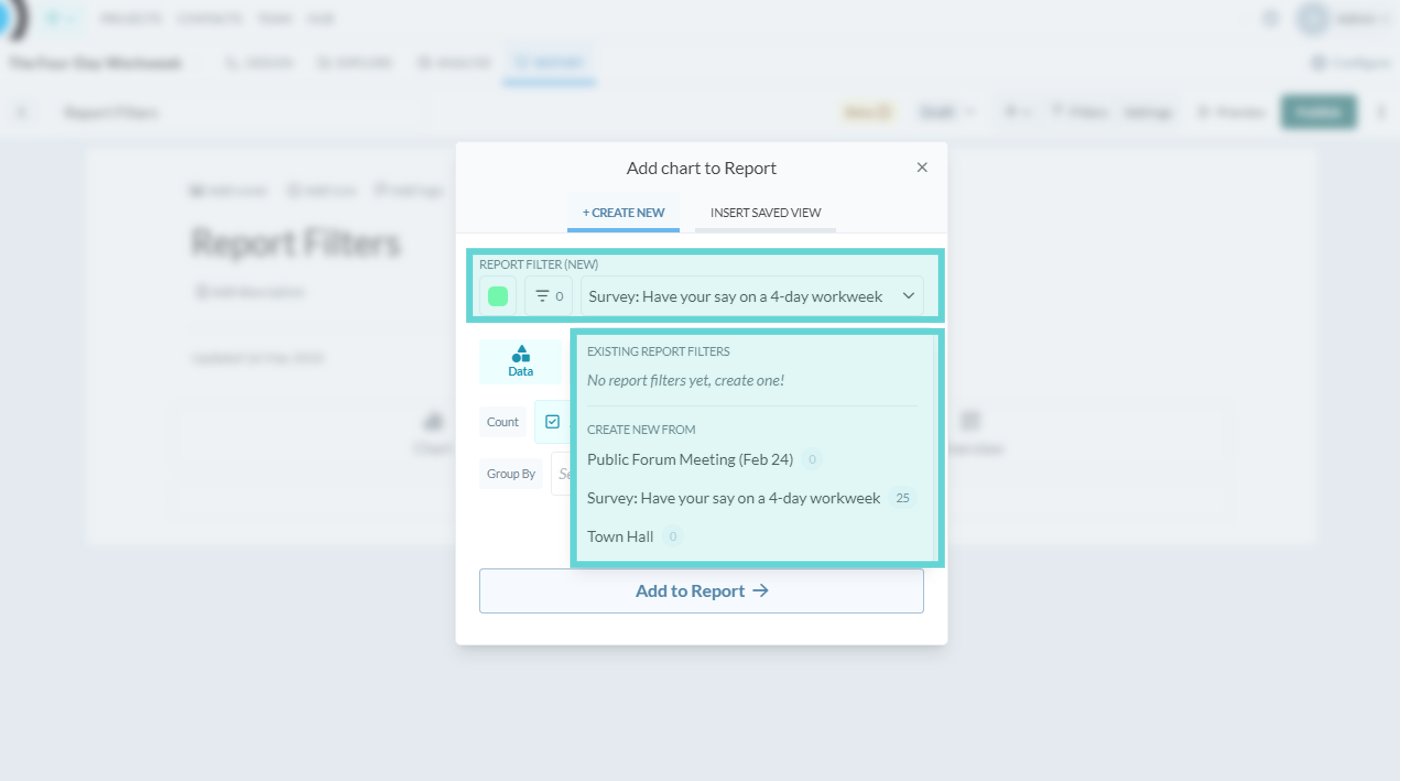
Add a new Report Filter
Change a visualisation’s report filter
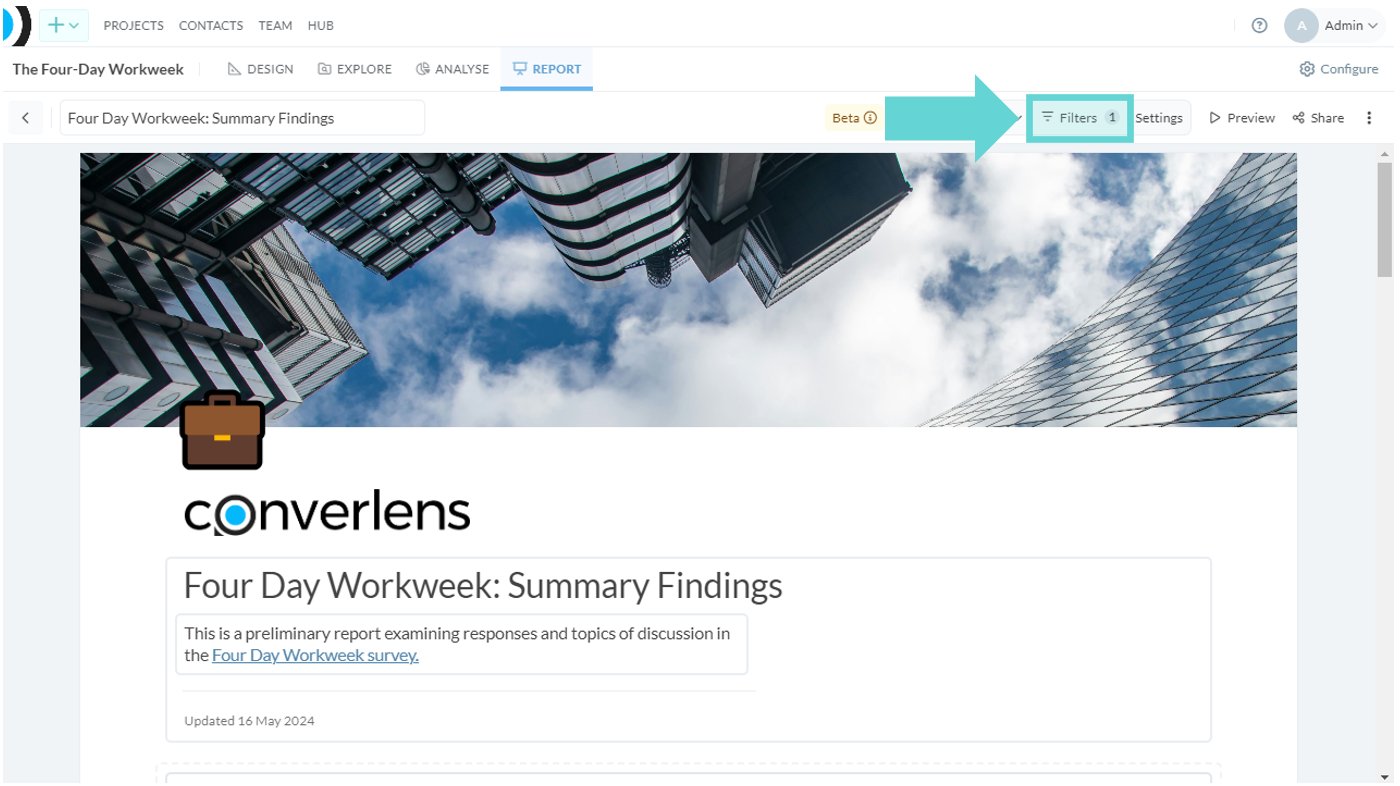
To change a visualisation’s (chart’s) report filter from one filter to another, hover over the tile of the chart you want to change. Click on the Filters button from the Chart settings menu: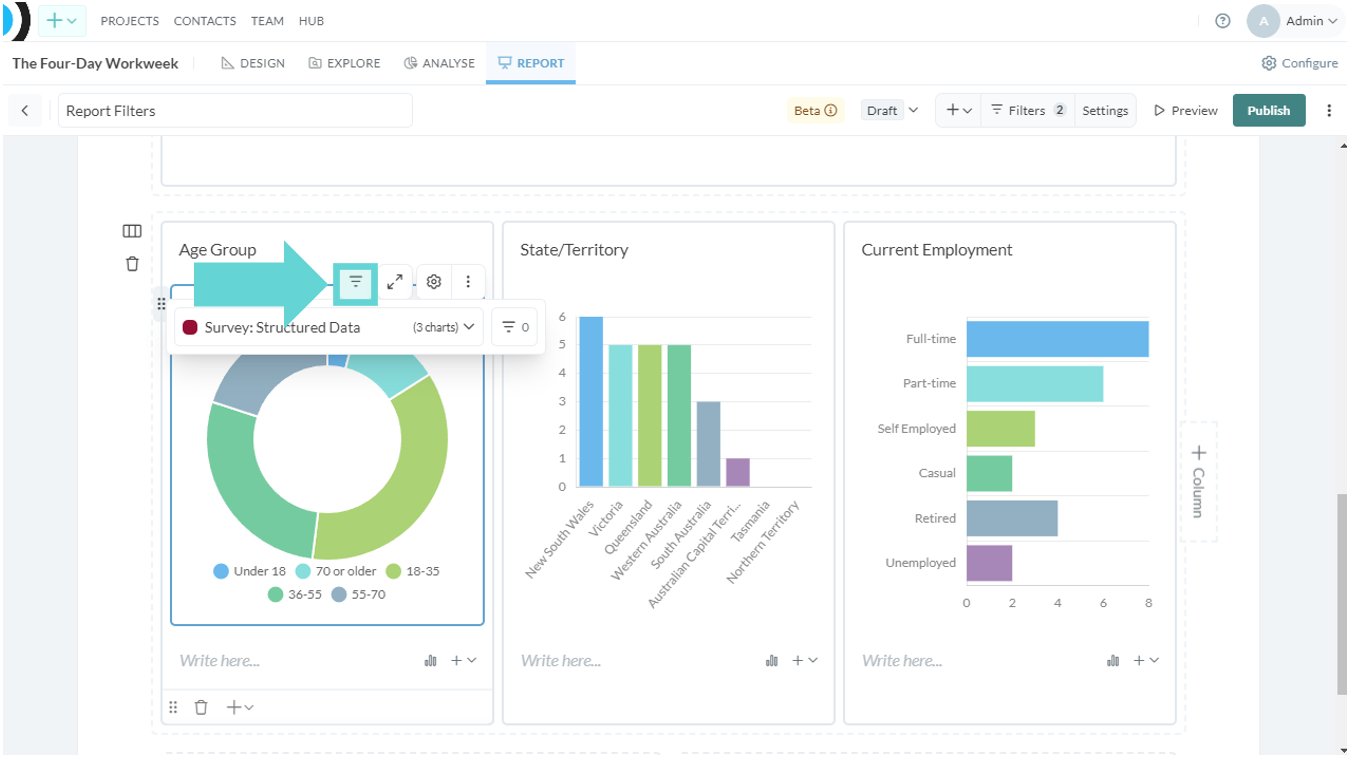
Add a Data Filter to a Report Filter