Add Results Overview to Report
To add the Results Overview to your report click the Overview button at the bottom of the report builder page. Alternatively, select the + button from the Toolbar and click Overview of results. Tip: Save your report after you’ve added the Results Overview to preserve any edits you make after adding.Edit Results Overview
A menu will appear above the Results Overview to enable editing of settings within the Overview.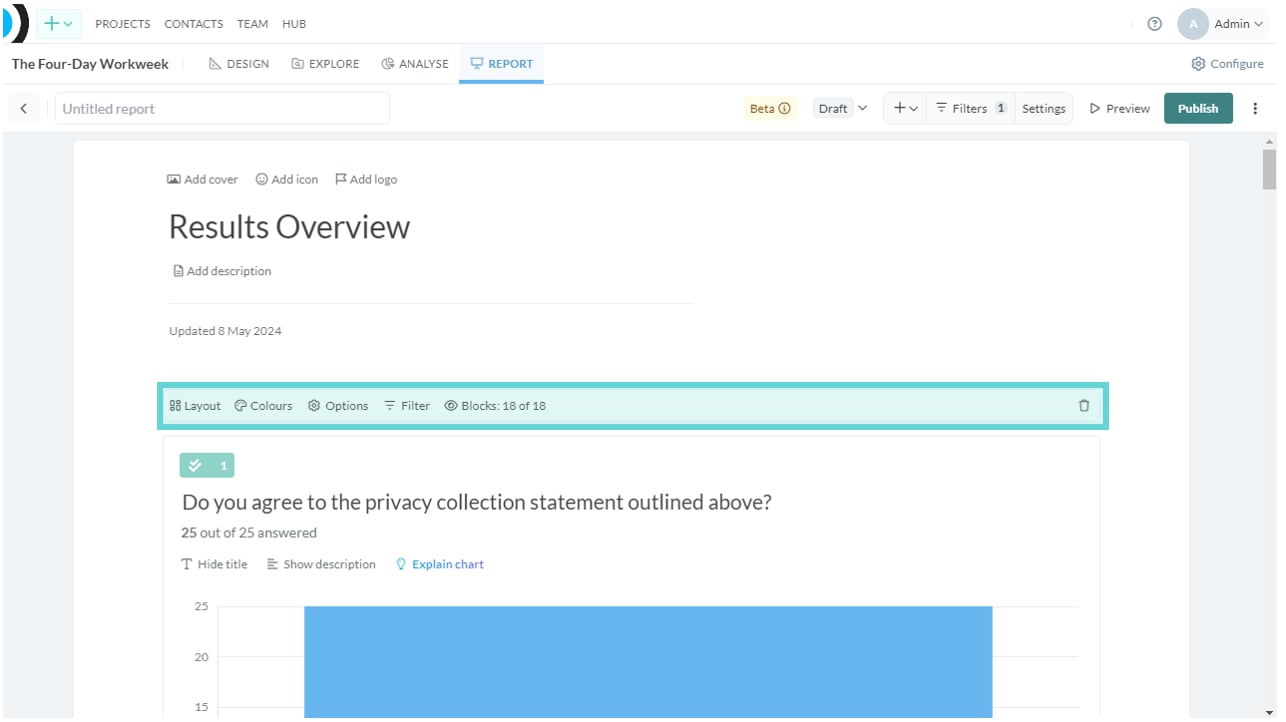
Layout
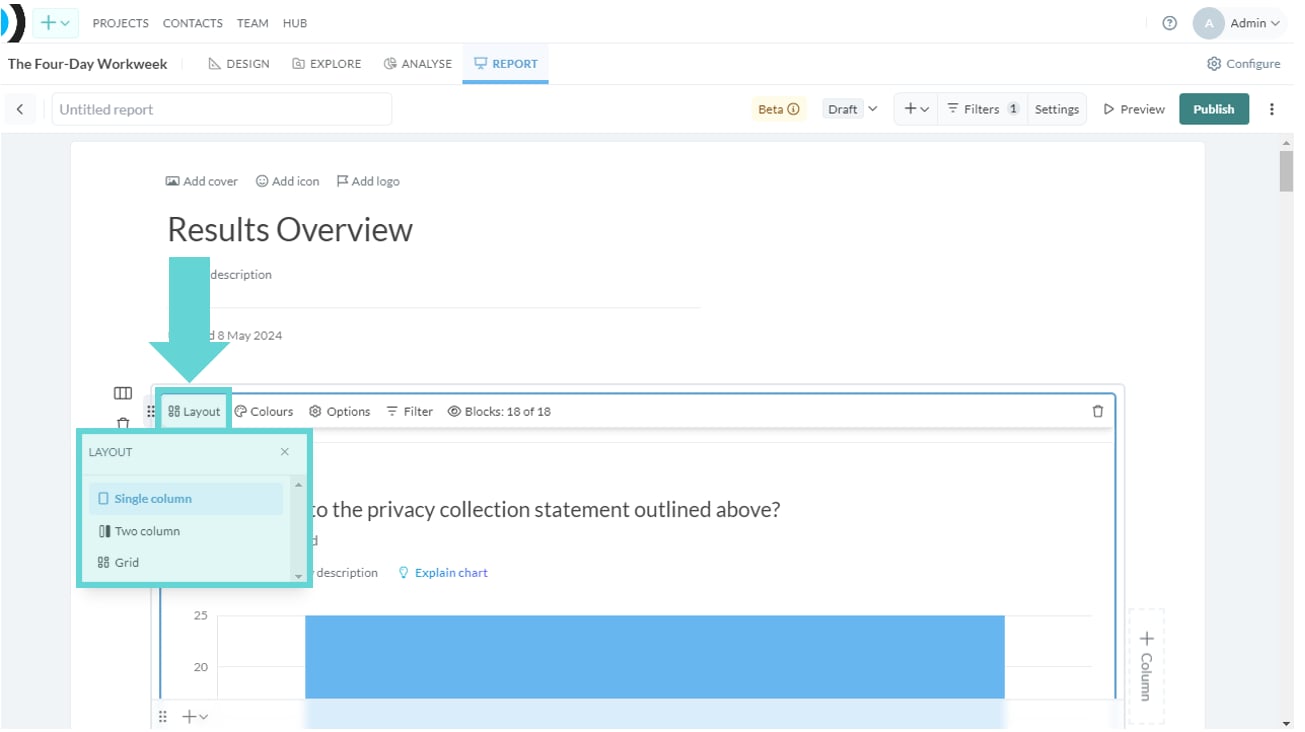
- Single column: Show each chart as one single view (A4)
- Two column: Split the Results Overview into two columns and show charts side by side (A4 split)
- Grid: Layout the Results Overview into a grid pattern.
Colours
Change the colour series of the charts displaying in the results overview. Click on Colours and a dropdown menu will appear. Select your preferred colour palette by clicking on the name of the series. The charts within Results Overview will change to the selected colour series. See also: Series.
Options
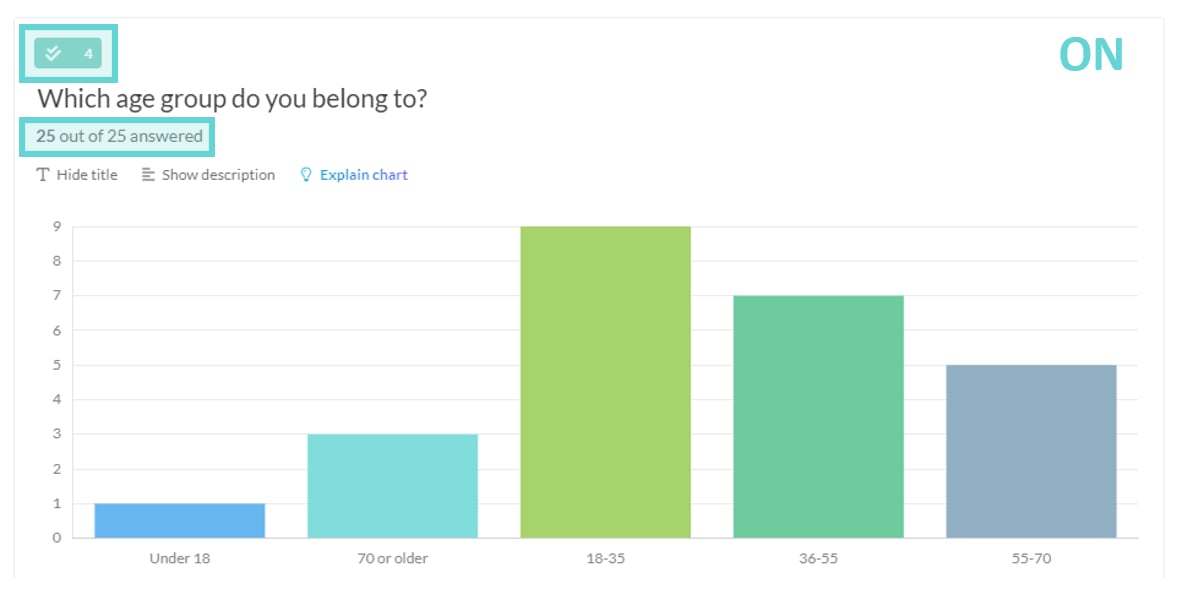
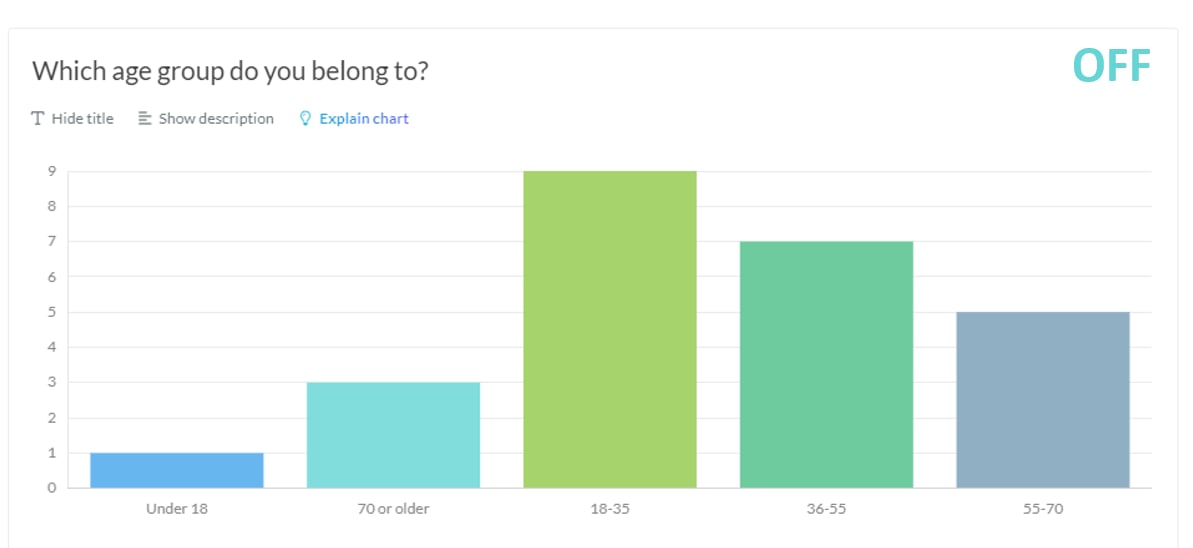
Options enables you to toggle settings on/off:- Block number indicator: Toggle on or off to show/hide the Block number indicator in the chart display area (above chart title)
- Count of answers: Toggle on or off to show/hide the Count of answers indicator in the chart display area (below chart title)
Filter
Blocks
Click on Blocks to display a dropdown menu of available blocks in the data space. Toggle the slider on/off to show/hide blocks from the Results Overview. Click Reset to display all blocks again.
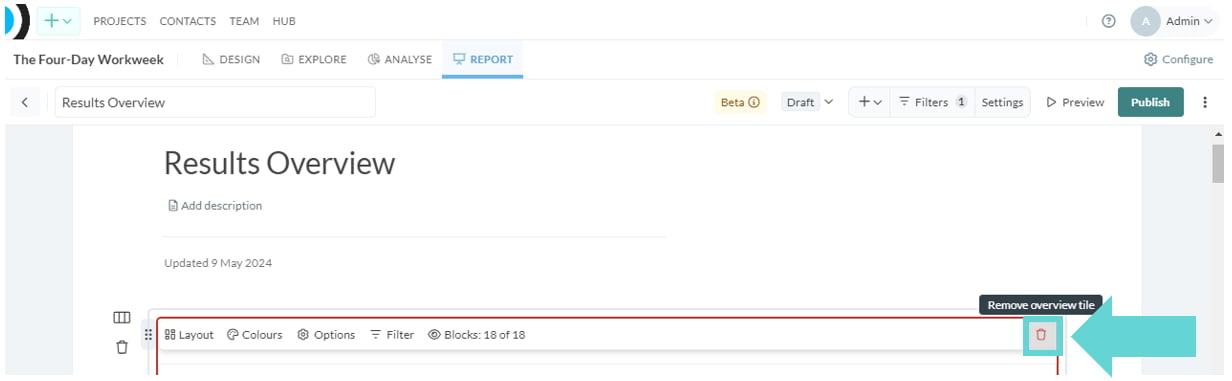
Delete Results Overview
To Delete the Results Overview, click on the bin icon in the right hand corner of the Results Overview menu. The Results Overview will be removed immediately.