About Clusters
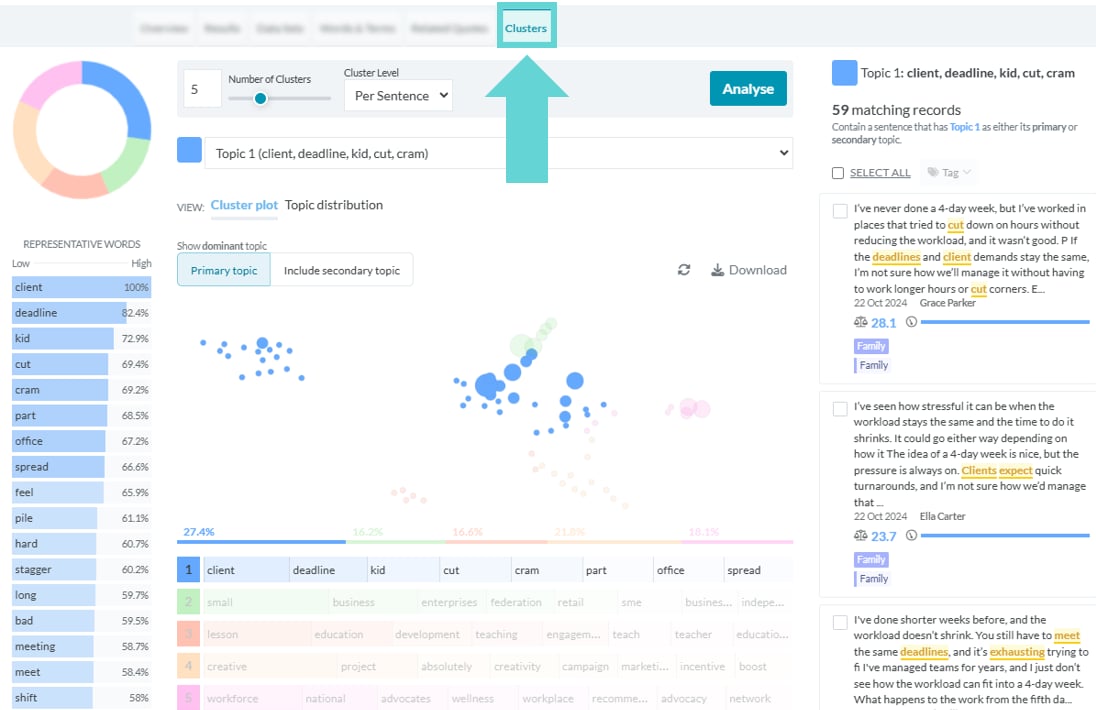
Clusters help visualise the relationships between different topics or themes that emerge from your dataset. Each cluster represents a distinct topic or theme, with the proximity of clusters indicating their similarity or relatedness. The size of each circle reflects the importance or prevalence of a topic within the dataset.- Larger circles represent highly frequent or dominant topics.
- Smaller circles indicate less frequently mentioned topics.
Where to find Clusters
To access Clusters, navigate to the Explore tab and select “Clusters” from the Navigation Tabs:Clusters options
Cluster Level (Per Record or Per Sentence)
Toggle between:- Per Record: Groups topics based on entire responses.
- Per Sentence: Identifies themes within individual sentences, providing more granular insights. (Recommended for capturing nuanced topics)
Number of clusters
Select between 3 to 10 clusters, depending on how broadly or narrowly you want to group topics.View as plot or topic distribution
Choose how to visualise the clusters:- Cluster Plot: Displays a spatial representation, showing the relationships between topics.
- Topic Distribution: Displays a ranked list of topics as a bar chart based on prevalence in the dataset.
Set Topic Level
- Primary Topic Only: Focuses on the main topic for each response.
- Include Secondary Topic: Display a second topic ring for each cluster.
Understanding Cluster Topics
Topics & Representative Words
Each cluster includes:- Topics: The broad topics identified in responses.
- Percentage: How frequently each topic appears in the dataset.
- Representative Words: Key terms within each topic, ranked from low to high saturation, with a percentage indicating their prominence.
Matching records
Displays the individual responses that match the currently selected topic.- Representative words in each response are highlighted for easy identification.
- Click any response to open it in Submission Reader for further review.
Selecting and Tagging Responses
To tag responses at the record level:- Select responses using the checkboxes.
- Click the Tag dropdown.
- Choose a tag and click Add.
- Confirm by selecting OK—the tag will be applied to selected responses.
Using the Cluster Tool
Analyse Button
Once settings are configured, click Analyse to process your dataset. The tool will:- Read through responses.
- Group sentences or responses discussing similar or related topics.
Topic Selection
Click on a topic to:- View its representative words.
- See matching responses related to that topic.
Refresh Button
Click Refresh to re-run the clustering process. Note: Cluster results may vary slightly with each refresh, as clustering algorithms dynamically adjust based on the dataset.Download Cluster Chart