About Data Sets
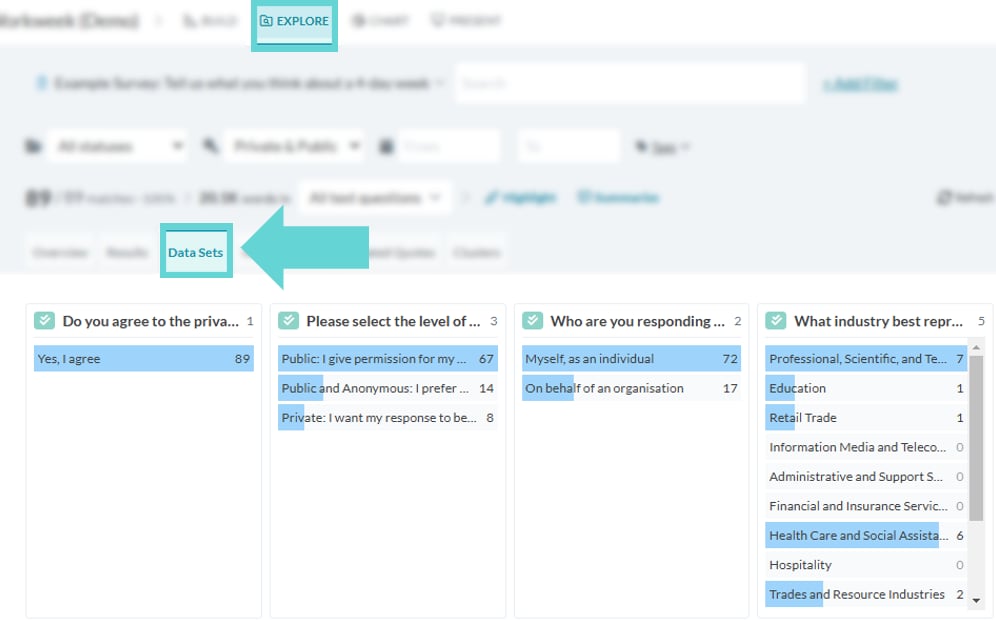
Data Sets displays quantitative questions from your survey data in labeled bar charts, providing a quick view of the results. Each section includes the question, the response options, and the number of matches for each option, displayed in blue bars with the count on the right-hand side. This visual representation allows for an easy and immediate understanding of the survey data distribution. Data Sets is designed to give you a quick view of your results. When you’re ready to dive deeper and explore detailed analysis or exportable formats, check out the Chart data visualisations and Results Overview features.Where to find Data Sets
To access Data Sets, navigate to the Explore tab and select “Data Sets” from the Navigation Tabs:Data Sets options
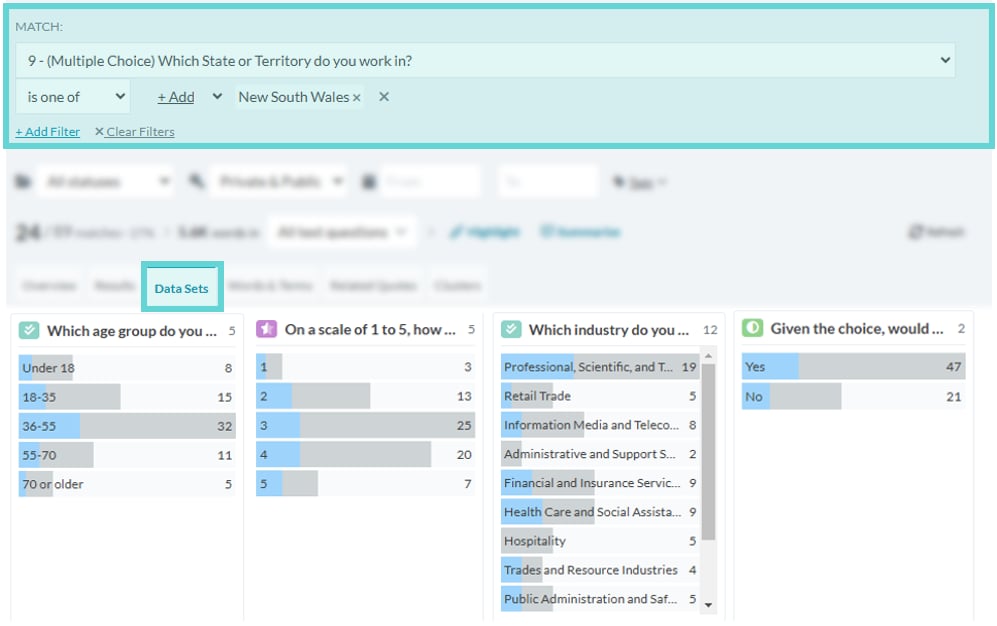
Filtering data set results